
Salesforce Reporting
5 Steps to Better Salesforce Reporting
Published on February 28, 2017 · 5 min read · Sabine Seichter
made with AI
Every company depends on meaningful metrics and information. They are the key to success.
Analyzed data lets you draw conclusions about a company's profitability, for example, and make forecasts for future decisions. Reports and dashboards show you how well you have performed in the past and what the current situation looks like.
High-quality reports help you identify the potential within your company. Costs can be significantly reduced and/or sales figures increased.
So it's worth investing some time and thought into this topic. To make the most of report creation, you should proceed strategically. Here are 5 steps to help you do that:
1. Identify the topics that matter to your leadership team
2. Capture the right data
3. Create reports
4. Create dashboards
5. Use the data to change behavior and achieve the results you want
Identify the relevant topics
Define which topics are relevant to achieving your business goals. What does management need to know to reach these goals more effectively? What are the most important metrics, and which behaviors should be encouraged?
Now think about how you can map these metrics to the corresponding functions in Salesforce.
Capture the right data
Plan ahead. Only a systematic approach will let you capture and display the right data.
Tip: Plan the report first, and only then configure the application by adding custom fields, formulas, and so on.
Limit the data you capture. You should select only a limited number of key performance indicators (KPIs) or metrics. This increases the usability of your reports. Always focus on the reports and dashboards that are aligned with very specific business goals.
For better discoverability, define a naming convention and a sensible folder structure. It should be descriptive — for example: “Dashboard – Sales Team South”.
Don't forget to define security and access. Access to a report is determined by the folder in which it is stored. Folders can be shared with individual users, groups, or roles.
Create reports
Salesforce offers different report types, ranging from simple to complex.
Predefined reports: These are standard reports for all standard objects. They can be used as the basis for your own custom reports.
Tabular reports: The simplest and fastest way to output data in a plain list format. However, tabular reports generally cannot be used to create dashboard components.
Summary reports: They present data with subtotals and other result data and are particularly well suited to showing, for example, the average value of won and closed opportunities by sales rep, or the number of cases by status and support agent.
Matrix reports: Matrix reports show data summaries based on horizontal and vertical criteria — for example, total revenue per sales rep and year, broken down by quarter.
Here's a brief overview of what the different reports can be used for in detail:
Analyze existing data
Estimate future developments
Ensure data quality
- Leads generated last month
- Value of all won and lost opportunities in the past year
- Target attainment per employee, by quarter
- Identifying seasonal trends by analyzing monthly order intake over the last 3 years
- Dashboard visualizing account segments by region, size, and industry
- Forecasting: expected order intake next quarter based on open opportunities
- Achievement of Customer Service KPIs in the current month
- Analyzing all existing contact records for completeness
- Reports filtered for erroneous values
- Daily report on all newly created leads to monitor quality.
Create dashboards
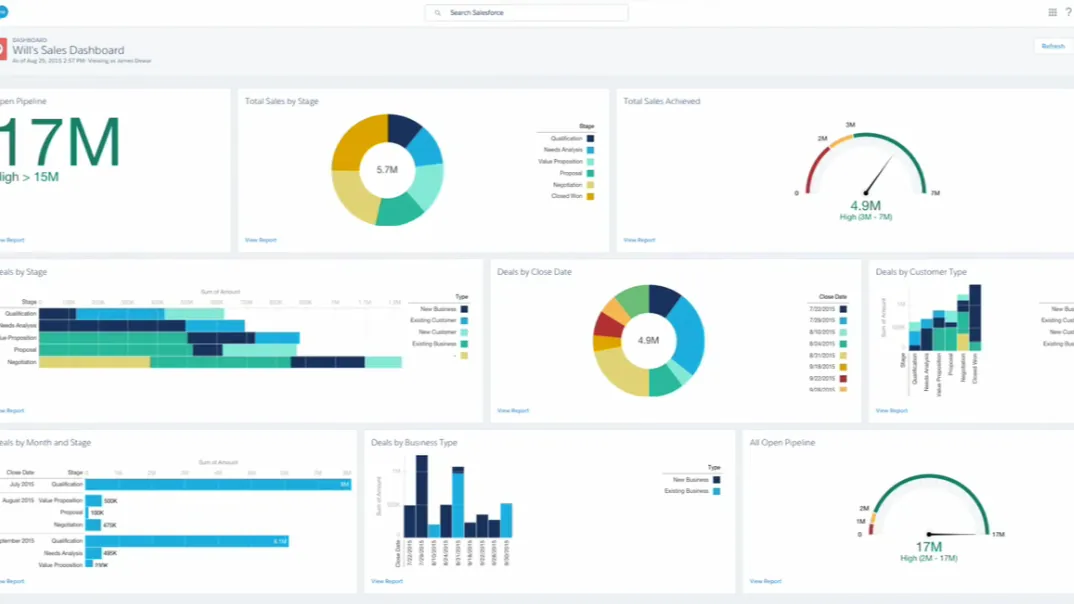
Once you have completed the steps described above, you can move on to creating dashboards. Here, too, there are different formats, for example:
Horizontal bar / vertical column charts: These are particularly well suited to geographic data, information about stage or status, or other data that can be assigned to a single group.
Pie and donut charts: These can be used to display data that represents shares of a whole — for example, the number of leads by lead source.
Funnel chart: Use this to create ordered picklists such as opportunity stage, case stage, or lead status.
Use the data to change behavior and improve results
Communication is the key to success! Your reports should always be current and relevant. Only then will you ensure that the reports you create are actually used.
Encourage management to make their forecast calls directly from their dashboards.
And involve the user level as well. Metrics and dashboards shouldn't be visible only at management level. Ask yourself which information is useful to your users and helps them do their work more efficiently.
Over time, a company typically accumulates vast amounts of relevant data. The challenge lies in filtering out the specific information you want and need from that mass of data.
We're happy to help. Also download our how-to guide “Report optimization with formula functions”.
You can learn more about Salesforce reporting in our current webinar. Alternatively, we also regularly offer dates for in-depth reporting training.
Originally published on blog.factory42.com
About the author
Senior Consultant, factory42
As a Senior Consultant at factory42, I am responsible for implementing the Salesforce Sales, Service and Marketing Clouds for our clients. My greatest asset in doing so is my several years of experience in hands-on marketing and sales — it means I know the typical challenges and routines our clients face. In client projects, I combine my process know-how with an understanding of how the business actually works and extensive experience in configuring and using the Salesforce clouds. What matters most to me is spotting concrete opportunities to improve processes and realising them with Salesforce. That way clients benefit immediately from time savings, better availability of information and high-quality processes.
More articles
made with AI
Unsere Highlights im Marketing Cloud Next Winter ‘27 Release
Was bringt das Winter ‘27 Release der Marketing Cloud Next? Unsere Top 6 Features inkl. Verfügbarkeit & Handlungsempfehlungen für Ihr Team.
Read article
Was die Braze-Übernahme für Ihr Marketing bedeutet
Salesforce kauft Braze für 5,66 Milliarden US-Dollar. Was sich für Kunden von Marketing Cloud und Braze ändert und wie Sie sich jetzt vorbereiten.
Read article
made with AI
Everyone Has AI. What Does It Know About Your Company?
Why context is the bottleneck for AI in sales and what it means for your deals. Live demo in our webinar on November 3, 2026.
Read article